Iteration 21. Fix bug with data
23-08-2025
Goal
How good is the BARC induction model on the different ARC datasets?
Motivation
I have discovered that I wasn't using the test samples when evaluating the BARC model. This make the problem harder in a way (because not all the training samples were given) and easier in another way (maybe the test samples are more difficult or cover some edge cases). On this iteration I need to stablish a good baseline so I can later check if test-time adaptation improves the scores.
I already know that data augmentation is helpful, so I will be using it by default on this iteration.
Results
Accuracy on the different datasets

| dataset | n_preds | valid code | valid outputs | unique outputs | pixel similarity | correct grids | train_pass_rate | train_pass@n | pass_rate | pass@n |
|---|---|---|---|---|---|---|---|---|---|---|
| training-arc-agi-1 | 240 | 100.00% | 81.42% | 43.10% | 61.40% | 14.66% | 12.41% | 61.75% | 12.17% | 61.25% |
| evaluation-arg-agi-1 | 464 | 100.00% | 73.62% | 45.19% | 56.56% | 2.85% | 1.98% | 23.00% | 1.95% | 22.25% |
| evaluation-arg-agi-2 | 264 | 100.00% | 71.29% | 51.58% | 50.43% | 0.11% | 0.07% | 0.83% | 0.06% | 0.83% |
To be able to solve ARC, we need a model that has the right intuitions about how to solve a task. That seems to be the case for the ARC-AGI-1 datasets where we see a constant improvement when making more predictions. But the dynamics for the ARC-AGI-2 dataset are different. It is worth mentioning that it seems that we would need around 32768 to solve the training set. That would be around 4 hours per task (a prediction takes 0.4 seconds). So even for the training set the resources allowed in the Kaggle submission are not enough.
These numbers are very similar to the ones that I have previously to solving the bug.
One good property of this model is that the pass rate of the task is almost identical to the pass rate of just the training samples. This implies that a function that is able to solve the training samples is very likely to solve also the test samples.
Effect of data augmentation
I have repeated the experiments without data augmentation and the results show the same tendency: data augmentation at inference is helpful.

| experiment | n_preds | valid code | valid outputs | unique outputs | pixel similarity | correct grids | train_pass_rate | train_pass@n | pass_rate | pass@n |
|---|---|---|---|---|---|---|---|---|---|---|
| baseline | 464 | 100.00% | 74.62% | 42.63% | 57.03% | 2.73% | 1.85% | 20.00% | 1.83% | 19.50% |
| data augmentation | 464 | 100.00% | 73.62% | 45.19% | 56.56% | 2.85% | 1.98% | 23.00% | 1.95% | 22.25% |
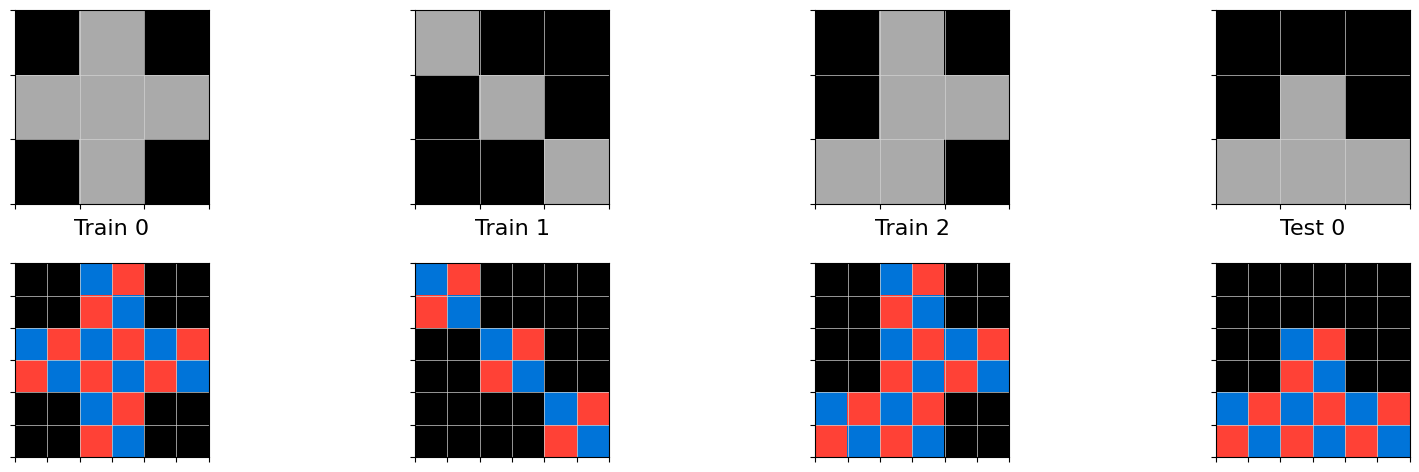
Examples of solved tasks
In general it seems that the model understands the solved tasks and the solutions look nice.
Click to expand/collapse this section
from common import *

import numpy as np
from typing import *

# concepts:
# scaling, color transformation

# description:
# In the input, you will see a 3x3 sprite with gray pixels scattered randomly.
# To create the output grid, you should first scale the sprite by a factor of 2,
# then replace all gray pixels with a pattern of alternating colors (blue and red).
# The scaled sprite should maintain the original size, and the pattern should cover the gray pixels only.

def transform(input_grid):
    # Step 1: Detect the gray pixels in the input grid
    gray_positions = np.argwhere(input_grid == Color.GRAY)

    # Step 2: Create a new output grid with the same size as the scaled sprite
    scale_factor = 2
    output_height = input_grid.shape[0] * scale_factor
    output_width = input_grid.shape[1] * scale_factor
    output_grid = np.full((output_height, output_width), Color.BLACK)

    # Step 3: Scale the input grid by the scale factor and place it in the output grid
    for i in range(input_grid.shape[0]):
        for j in range(input_grid.shape[1]):
            if input_grid[i, j] != Color.BLACK:
                # Blit the original color in the scaled position
                blit_sprite(output_grid, np.full((scale_factor, scale_factor), input_grid[i, j]),
                            x=i*scale_factor, y=j*scale_factor)

    # Step 4: Replace gray pixels in the scaled grid with the alternating pattern
    for x, y in gray_positions:
        scaled_x, scaled_y = x * scale_factor, y * scale_factor
        # Create a 2x2 alternating pattern of blue and red
        pattern = np.array([[Color.BLUE, Color.RED],
                            [Color.RED, Color.BLUE]])
        blit_sprite(output_grid, pattern, scaled_x, scaled_y)

    return output_grid
from common import *

import numpy as np
from typing import *

# concepts:
# pattern generation, lines

# description:
# In the input you will see two red pixels.
# To make the output, you should create a pattern of blue squares and red lines that connect the two red pixels.
# The pattern consists of blue squares filling the area between the two red pixels,
# and the red lines should extend vertically and horizontally from the red pixels to the edges of the canvas.

def transform(input_grid):
    # Find the positions of the two red pixels
    red_positions = np.argwhere(input_grid == Color.RED)
    if len(red_positions) != 2:
        raise ValueError("Input grid must contain exactly two red pixels.")

    (x1, y1), (x2, y2) = red_positions

    # Determine the bounding box for the blue squares
    min_x, max_x = min(x1, x2), max(x1, x2)
    min_y, max_y = min(y1, y2), max(y1, y2)

    # Create blue squares in the bounding box
    output_grid = np.zeros_like(input_grid)
    output_grid[min_x:max_x + 1, min_y:max_y + 1] = Color.BLUE

    # Draw red lines from the red pixels to the edges of the canvas
    draw_line(output_grid, x1, y1, color=Color.RED, direction=(1, 0))  # Right from first red pixel
    draw_line(output_grid, x1, y1, color=Color.RED, direction=(-1, 0)) # Left from first red pixel
    draw_line(output_grid, x1, y1, color=Color.RED, direction=(0, 1))  # Down from first red pixel
    draw_line(output_grid, x1, y1, color=Color.RED, direction=(0, -1)) # Up from first red pixel

    draw_line(output_grid, x2, y2, color=Color.RED, direction=(1, 0))  # Right from second red pixel
    draw_line(output_grid, x2, y2, color=Color.RED, direction=(-1, 0)) # Left from second red pixel
    draw_line(output_grid, x2, y2, color=Color.RED, direction=(0, 1))  # Down from second red pixel
    draw_line(output_grid, x2, y2, color=Color.RED, direction=(0, -1)) # Up from second red pixel

    return output_grid
from common import *

import numpy as np
from typing import *

# concepts:
# circle detection, color transformation

# description:
# In the input, you will see a grid with random colored pixels on it.
# To make the output, you should find all circular shapes (of any color)
# with a diameter greater than or equal to 3 pixels and change their color to yellow.

def transform(input_grid: np.ndarray) -> np.ndarray:
    # Plan:
    # 1. Detect circular shapes in the grid
    # 2. Change their color to yellow if they meet the size criteria

    output_grid = np.copy(input_grid)

    # Iterate over the grid to find circular shapes
    for x in range(len(input_grid)):
        for y in range(len(input_grid[0])):
            # Check if the pixel is not background
            if input_grid[x, y] != Color.BLACK:
                # Check for circle shape using a simple heuristic
                # We will consider a circle if it has a certain diameter
                diameter = 1
                while True:
                    # Check the pixels in the current diameter
                    if (x + diameter < len(input_grid) and
                        y + diameter < len(input_grid[0]) and
                        np.all(input_grid[x:x + diameter + 1, y:y + diameter + 1] == input_grid[x, y])):
                        diameter += 1
                    else:
                        # We found the maximum diameter
                        diameter -= 1
                        break

                # If the diameter is 2 or more, we consider it a circle
                if diameter >= 3:
                    output_grid[x:x + diameter + 1, y:y + diameter + 1] = Color.YELLOW

    return output_grid
Conclusion
BARC induction model is a strong foundation. I believe I should be able to validate my ideas to combine search and learn with it.
Next steps
- I need to experiment with test-time training methods to see if I'm able to improve this metrics
- We need to increase the prediction efficiency of this model. This would be very likely achieved with reinforcement learning.
- I'm not exploiting the interactive nature of programming. The model should refine the code using execution feedback. Maybe the model can do this natively, but very likely needs also training.
- It is possible that ARC-AGI-2 data is out of distribution, and maybe we should label all ARC-AGI-2 tasks and generate new data a la BARC to be able to solve those tasks.
TODO
- Visualize the solved tasks
- Add warnings in the previous iterations